
Practice Test #4
Simulate the real exam experience with 50 questions and a 100-minute time limit. Practice with AI-verified answers and detailed explanations.
AI-Powered
Triple AI-Verified Answers & Explanations
Every answer is cross-verified by 3 leading AI models to ensure maximum accuracy. Get detailed per-option explanations and in-depth question analysis.
Practice Questions
DRAG DROP -
You plan to create a report that will display sales data from the last year for multiple regions. You need to restrict access to individual rows of the data on a per region-basis by using roles. Which four actions should you perform in sequence? To answer, move the appropriate actions from the list of actions to the answer area and arrange them in the correct order. Select and Place:
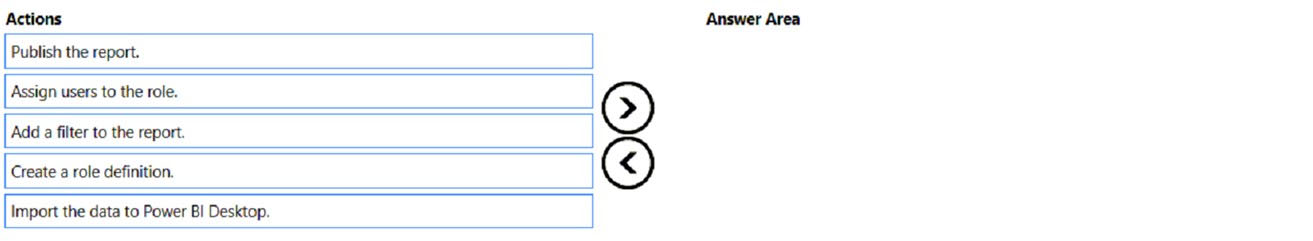
Which sequence correctly configures row-level security for regional sales data?
You have a Power BI query named Sales that imports the columns shown in the following table.
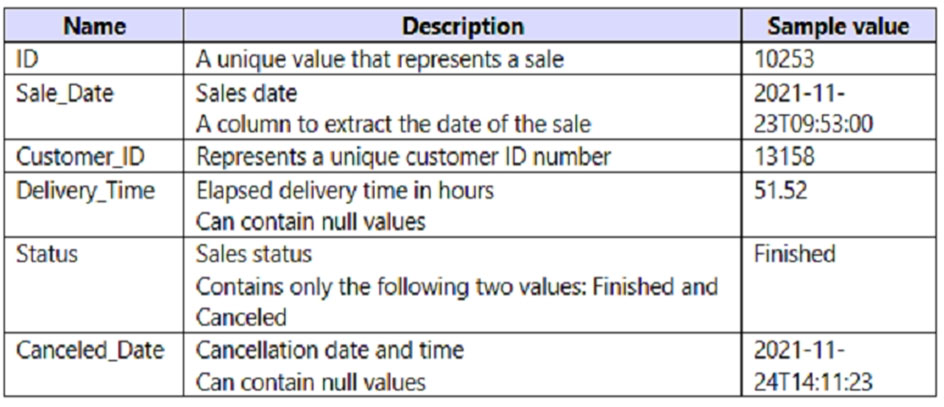
Users only use the date part of the Sales_Date field. Only rows with a Status of Finished are used in analysis. You need to reduce the load times of the query without affecting the analysis. Which two actions achieve this goal? Each correct answer presents a complete solution. NOTE: Each correct selection is worth one point.
You have the Power BI model shown in the following exhibit.
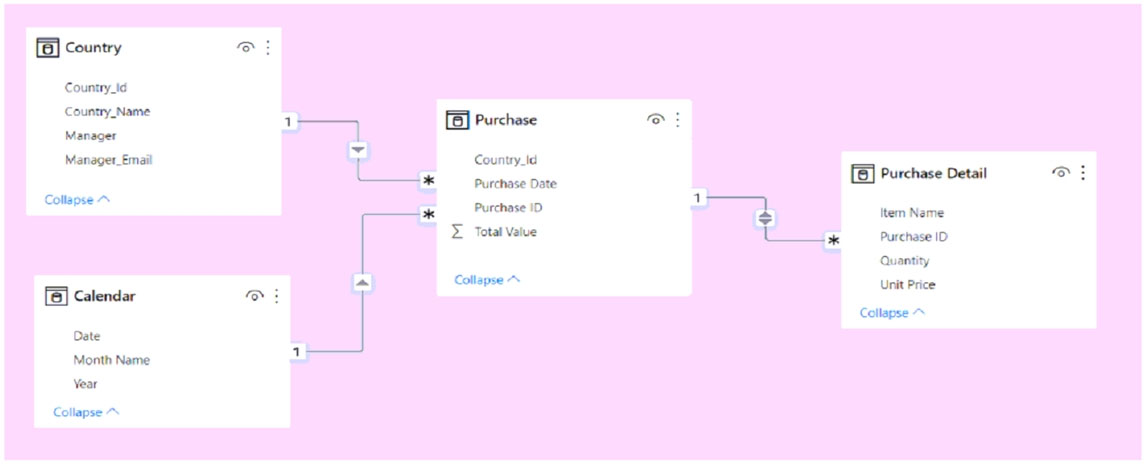
A manager can represent only a single country. You need to use row-level security (RLS) to meet the following requirements: ✑ The managers must only see the data of their respective country. ✑ The number of RLS roles must be minimized. Which two actions should you perform? Each correct answer presents a complete solution. NOTE: Each correct selection is worth one point.
DRAG DROP -
You are preparing a financial report in Power BI. You connect to the data stored in a Microsoft Excel spreadsheet by using Power Query Editor as shown in the following exhibit.
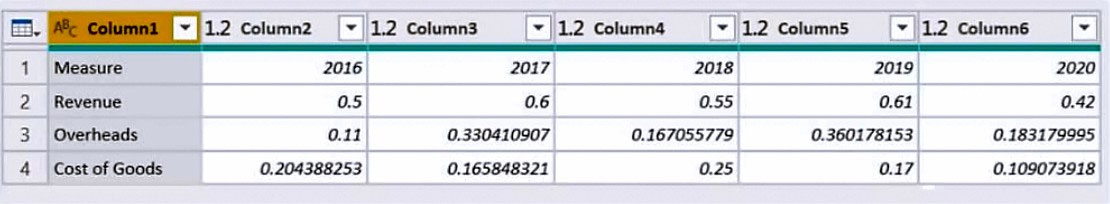
You need to prepare the data to support the following: ✑ Visualizations that include all measures in the data over time ✑ Year-over-year calculations for all the measures Which four actions should you perform in sequence? To answer, move the appropriate actions from the list of actions to the answer area and arrange them in the correct order. Select and Place:
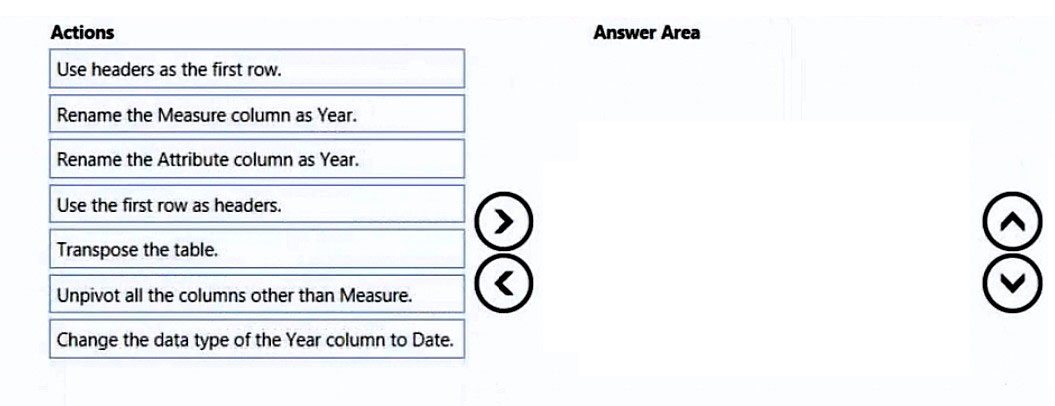
Which sequence correctly reshapes the financial report data for time-series reporting?
You need to provide a user with the ability to add members to a workspace. The solution must use the principle of least privilege. Which role should you assign to the user?
Want to practice all questions on the go?
Download Cloud Pass — includes practice tests, progress tracking & more.
DRAG DROP -
You create a data model in Power BI. Report developers and users provide feedback that the data model is too complex. The model contains the following tables.
| Table name | Column name | Data type |
|---|---|---|
| Sales_Region | region_id | Integer |
| name | Varchar
Region_Manager | region_id | Integer | manager_id | Integer Sales_Manager | sales_manager_id | Integer | name | Varchar | region_id | Integer Manager | manager_id | Integer | name | Varchar The model has the following relationships: ✑ There is a one-to-one relationship between Sales_Region and Region_Manager. ✑ There are more records in Manager than in Region_Manager, but every record in Region_Manager has a corresponding record in Manager. ✑ There are more records in Sales_Manager than in Sales_Region, but every record in Sales_Region has a corresponding record in Sales_Manager. You need to denormalize the model into a single table. Only managers who are associated to a sales region must be included in the reports. Which three actions should you perform in sequence? To answer, move the appropriate actions from the list of actions to the answer area and arrange them in the correct order. NOTE: More than one order of answer choices is correct. You will receive credit for any of the correct orders you select. Select and Place:
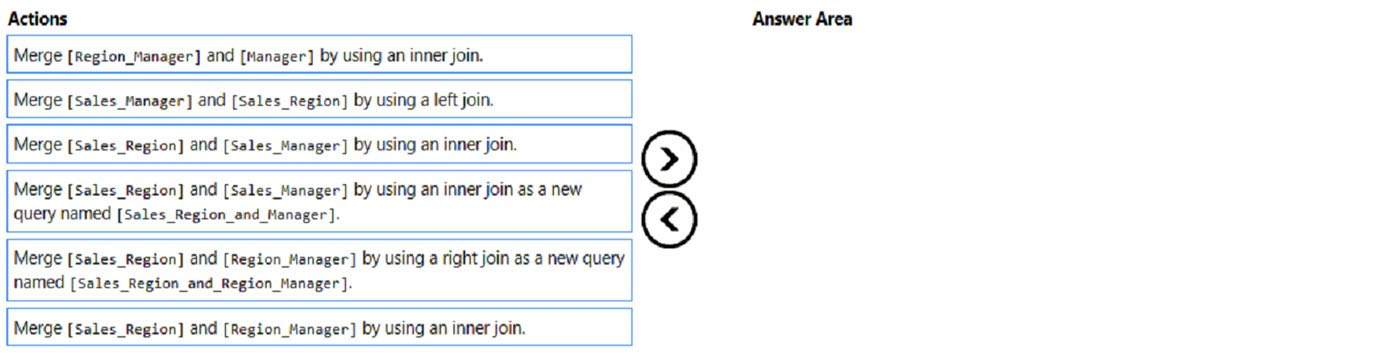
Which merge sequence simplifies the model while preserving the required region-manager relationships?
A user creates a Power BI report named ReportA that uses a custom theme. You create a dashboard named DashboardA. You need to ensure that DashboardA uses the custom theme. The solution must minimize development effort. Which two actions should you perform? Each correct answer presents part of the solution. NOTE: Each correct selection is worth one point.
HOTSPOT - You publish the dataset to powerbi.com. For each of the following statements, select Yes if the statement is true. Otherwise, select No. NOTE: Each correct selection is worth one point. Hot Area:
You need an on-premises data gateway to refresh the dataset.
You need to configure a scheduled refresh of the dataset.
You can use Basic authentication on the dataset to connect to the data.
Note: This question is part of a series of questions that present the same scenario. Each question in the series contains a unique solution that might meet the stated goals. Some question sets might have more than one correct solution, while others might not have a correct solution. After you answer a question in this section, you will NOT be able to return to it. As a result, these questions will not appear in the review screen. You have a Power BI report that imports a date table and a sales table from an Azure SQL database data source. The sales table has the following date foreign keys: ✑ Due Date ✑ Order Date ✑ Delivery Date You need to support the analysis of sales over time based on all the date foreign keys. Solution: For each date foreign key, you add inactive relationships between the sales table and the date table. Does this meet the goal?
HOTSPOT - You need to create a relationship in the dataset for RLS. What should you do? To answer, select the appropriate options in the answer area. NOTE: Each correct selection is worth one point. Hot Area:
Create a ______ relationship between the Sales Employees table and the ______ table.
Create a ______ relationship between the Sales Employees table and the ______ table.

Start Practicing Now
Download Cloud Pass and start practicing all PL-300: Microsoft Power BI Data Analyst exam questions.
Get the app