CloudPass LogoCloud Pass
AWSGoogle CloudMicrosoftCiscoCompTIADatabricks
Certifications
AWSGoogle CloudMicrosoftCiscoCompTIADatabricks
  1. Cloud Pass
  2. GCP
  3. Google Professional Cloud DevOps Engineer
Google Professional Cloud DevOps Engineer

GCP

Google Professional Cloud DevOps Engineer

199+ Practice Questions with AI-Verified Answers

Free questions & answersReal Exam Questions
AI-powered explanations
Detailed Explanation
Real exam-style questionsClosest to the Real Exam
Browse 199+ Questions

AI-Powered

Triple AI-Verified Answers & Explanations

Every Google Professional Cloud DevOps Engineer answer is cross-verified by 3 leading AI models to ensure maximum accuracy. Get detailed per-option explanations and in-depth question analysis.

GPT Pro
Claude Opus
Gemini Pro
Per-option explanations
In-depth question analysis
3-model consensus accuracy

Exam Domains

Bootstrapping and Maintaining a Google Cloud OrganizationWeight 20%
Building and Implementing CI/CD Pipelines (Application, Infrastructure, ML Workloads)Weight 25%
Applying Site Reliability Engineering (SRE) PracticesWeight 18%
Implementing Observability Practices and Troubleshooting IssuesWeight 25%
Optimizing Performance and CostWeight 12%

Practice Questions

1
Question 1

Your media-streaming company operates on Google Cloud with 6 departments each mapped to a folder under the organization; there are 120 existing projects and about 10 new projects are created every month, and the security team requires that every log entry (all log types and resource types, across all regions) be exported in near real time to a third-party SIEM that ingests from a Cloud Pub/Sub topic named siem-ingest, so you must implement a solution that automatically covers all current and future projects with minimal ongoing maintenance and does not move logs into Cloud Logging buckets; what should you do?

Incorrect. An organization-level aggregated sink is the right scope for covering all current and future projects, but the destination is a Cloud Logging log bucket. The prompt explicitly requires exporting to a third-party SIEM that ingests from Pub/Sub and says the solution must not move logs into Cloud Logging buckets. This option violates the destination constraint and does not satisfy the SIEM integration requirement.

Partially correct but not best. Folder-level aggregated sinks to Pub/Sub would work for exporting logs, but you must create and manage 6 sinks (one per department folder). That increases ongoing maintenance and introduces risk if projects move between folders or if organizational structure changes. Since the requirement is to cover all projects with minimal maintenance, an organization-level sink is preferred.

Correct. An organization-level aggregated sink exporting to the siem-ingest Pub/Sub topic automatically includes logs from all existing projects and any new projects created in the organization, meeting the minimal maintenance requirement. Using an inclusion filter that matches all logs (e.g., resource.type:* or no filter) ensures all log types and resource types are exported in near real time via Pub/Sub, without using Cloud Logging buckets.

Incorrect. Project-level sinks require configuring 120 existing projects and then repeating the process for ~10 new projects each month. This is high operational overhead and prone to misconfiguration, leading to gaps in SIEM coverage. It directly contradicts the requirement for minimal ongoing maintenance and automatic coverage of future projects.

Question Analysis

Core Concept: This question tests Cloud Logging sinks (especially aggregated sinks) and how to export logs at scale across an organization with minimal maintenance. It also tests choosing the correct sink scope (project/folder/org) and destination type (Pub/Sub) to integrate with an external SIEM in near real time. Why the Answer is Correct: An organization-level aggregated sink exports logs from all projects in the organization, including future projects, without needing per-project configuration. Because the SIEM ingests from a Pub/Sub topic (siem-ingest) and the requirement explicitly says not to move logs into Cloud Logging buckets, the sink destination must be Pub/Sub (not a log bucket). Setting an inclusion filter that matches all logs (for example, resource.type:* or an empty filter) ensures all log types and resource types are exported. This meets the “all regions” requirement because Cloud Logging is a global service and the sink captures logs regardless of where resources run. Key Features / Configurations / Best Practices: - Use an organization-level aggregated sink with destination pubsub.googleapis.com/projects/PROJECT_ID/topics/siem-ingest. - Ensure the sink’s writer identity has Pub/Sub Publisher on the topic. - Consider Pub/Sub throughput and retention: SIEM ingestion bursts may require adequate topic quotas and subscriber scaling. - Use a single org-level sink to minimize operational overhead; this aligns with the Google Cloud Architecture Framework principle of operational excellence (centralized, automated governance). Common Misconceptions: - “Repeat per folder” (option B) can seem centralized, but it still creates 6 sinks and ongoing governance overhead; it also risks gaps if projects are moved between folders or new folders are added. - “Project-level sinks” (option D) are the most error-prone at this scale and violate the minimal maintenance requirement. - “Use a log bucket destination” (option A) conflicts with the requirement not to move logs into Cloud Logging buckets and doesn’t directly feed a third-party SIEM via Pub/Sub. Exam Tips: - If the requirement is “all current and future projects,” prefer organization-level aggregated sinks (or folder-level if scope is intentionally limited). - If the destination is an external system, Pub/Sub is the common near-real-time export mechanism. - Watch for constraints like “do not move logs into buckets” which rules out log bucket destinations and often points to Pub/Sub or BigQuery exports.

2
Question 2

You manage the release pipeline for a payments API running on a regional GKE cluster in us-central1. The API is exposed via a Kubernetes Service (ClusterIP) behind an HTTP Ingress managed by Cloud Load Balancing. You implement blue/green by running two Deployments: pay-blue-v1 and pay-green-v2, each with 10 replicas and labels color=blue/green. During the cutover, you updated the Service selector to color=green to send 100% of ~1,500 RPS to pay-green-v2. Within 2 minutes, the HTTP 5xx error rate spikes to 7%, breaching the 1% SLO target. You must roll back immediately with less than 30 seconds of impact, without rebuilding images or modifying the Ingress configuration. What should you do?

kubectl rollout undo on the green Deployment changes which ReplicaSet backs the green Deployment, but it does not directly address the routing decision that sent 100% of traffic to green. It can also take longer than a Service selector flip because Pods may need to be recreated and become Ready. Additionally, “previous ReplicaSet” for green may not correspond to the known-good blue version.

Deleting the container image from Artifact Registry and deleting green Pods is an operationally risky and slow response. Image deletion is not an immediate rollback mechanism and can break future rollouts or node image pulls. Deleting Pods can cause churn and transient errors, and it does not guarantee traffic returns to blue unless the Service selector is also changed.

Updating the Service selector back to color=blue is the canonical rollback for Service-based blue/green. It is fast (single object update), does not require rebuilding images, and does not require any Ingress changes because the load balancer still targets the same Service. It restores the last known-good backend set with minimal propagation delay and minimal incident scope.

Scaling the green Deployment to zero removes endpoints, which can force traffic away only indirectly (and may cause 5xx while endpoints are removed and connections reset). It also does not explicitly restore the known-good blue routing; it relies on the Service having alternative endpoints, and timing can be less predictable than a selector flip. It’s a harsher mitigation than necessary.

Question Analysis

Core concept: This tests fast rollback for blue/green on GKE when traffic is shifted by changing a Kubernetes Service selector. The Ingress and Cloud Load Balancer route to the Service; the Service selector determines which Pods receive traffic. In SRE terms, you need a rapid mitigation to restore SLOs with minimal blast radius and without changing higher-level routing. Why the answer is correct: You already performed the cutover by changing the Service selector from color=blue to color=green. The fastest, lowest-risk rollback that meets “<30 seconds of impact” and avoids rebuilding images or modifying the Ingress is to immediately change the Service selector back to color=blue. This restores the previous known-good backend set (pay-blue-v1) while leaving the green Deployment intact for later debugging. The change is a small API update to the Service object; kube-proxy/iptables (or eBPF dataplane) updates endpoints quickly, and the load balancer continues to send traffic to the same Service VIP, so no Ingress/GLB propagation delay is involved. Key features / best practices: - Blue/green on Kubernetes commonly uses a stable Service with a selector flip; rollback is the same flip back. - This aligns with Google Cloud Architecture Framework reliability principles: design for fast recovery and minimize change scope during incidents. - Keeping green running preserves evidence (logs/metrics/traces) and enables controlled re-test. Common misconceptions: - Rolling back the green Deployment (kubectl rollout undo) changes green’s Pods, but your immediate issue is that traffic is currently routed to green. Even if undo succeeds, it may not restore the exact blue version and can take longer than a selector flip. - Deleting images or Pods is slow, risky, and not a deterministic rollback mechanism. - Scaling green to zero can work, but it forces failure/endpoint churn and may cause transient 5xx while endpoints drain; it’s also less explicit than restoring the known-good backend. Exam tips: When Ingress is stable and blue/green is implemented via Service selectors, the quickest rollback is to revert the selector to the previous label. Prefer the smallest reversible change that restores a known-good state, and avoid actions that introduce additional moving parts (image deletion, rollouts) during an incident.

3
Question 3

Your company runs a payments API behind an NGINX Ingress Controller on a GKE Standard cluster with three n2-standard-4 nodes; the Ops Agent DaemonSet is deployed on all nodes and forwards access logs to Cloud Logging. In the past hour you observed suspicious traffic from the IP address 198.51.100.77, and you need to visualize the per-minute count of requests from this IP in Cloud Monitoring without changing application code or deploying additional collectors. What should you do to achieve this with minimal operational overhead?

Correct. This uses existing log ingestion (Ops Agent -> Cloud Logging) and a managed logs-based counter metric to convert matching log entries into a Monitoring time series. Filtering on the client IP (198.51.100.77) yields a per-minute request count when charted with 60-second alignment. It meets the constraints: no app changes and no additional collectors, with minimal operational overhead.

Incorrect. A CronJob that scrapes logs and pushes custom metrics adds operational burden (scheduling, permissions, retries, scaling, parsing correctness) and is fragile under load or log rotation. It also duplicates functionality already provided by logs-based metrics. While it can work, it violates the “minimal operational overhead” requirement and is not the recommended managed approach for log-derived counts.

Incorrect. Modifying the payments API to export per-IP counters requires application code changes, redeployments, and careful metric cardinality management (per-IP metrics can explode in cardinality and cost). The question explicitly forbids changing application code. Even with OpenTelemetry, this is heavier than necessary because the needed signal already exists in ingress access logs.

Incorrect. Ops Agent metrics receivers collect system and supported application metrics (CPU, memory, disk, some service metrics), but they do not infer per-client-IP request counts from access logs. Per-IP request data is typically only available in HTTP access logs or specialized L7 telemetry. Relying on node/application metrics will not produce the requested per-minute counts for a specific IP.

Question Analysis

Core concept: This question tests Google Cloud observability patterns on GKE: turning existing log streams (NGINX Ingress access logs already in Cloud Logging via Ops Agent) into time-series data in Cloud Monitoring using logs-based metrics, without changing application code or adding collectors. Why the answer is correct: You already have the ingress access logs centralized in Cloud Logging. The lowest-overhead way to visualize “requests per minute from a specific client IP” is to create a logs-based counter metric that matches log entries where the client IP equals 198.51.100.77. Cloud Logging will count matching entries and export the metric to Cloud Monitoring, where you can chart it with 1-minute alignment/aggregation. This approach is managed, scalable, and requires no new runtime components in the cluster. Key features / configurations: - Ops Agent logging receiver: ensure the NGINX Ingress access log file/stream is being ingested (often via a file receiver or fluent-bit pipeline depending on setup). If logs are already present in Cloud Logging, no further agent changes may be needed. - Logs-based metrics (counter): define a filter on the log payload field that contains the client IP (for NGINX, typically remote_addr / client_ip in structured logs, or parsed from text). Use a counter metric to count each matching entry. - Cloud Monitoring charting: create a chart for the logs-based metric and set alignment period to 60s to get per-minute counts. Optionally add grouping labels if you want to pivot by ingress, namespace, or status code. - Architecture Framework alignment: this follows the Observability pillar—use centralized logging/metrics with managed services, minimize operational burden, and enable rapid investigation. Common misconceptions: - “Need a custom metric pipeline”: Many assume you must scrape logs and push custom metrics. Logs-based metrics already provide a managed conversion from logs to metrics. - “Use node/application metrics”: Standard metrics receivers won’t produce per-client-IP request counts; that data is in access logs, not typical system metrics. Exam tips: When you need metrics derived from logs (counts, rates, error patterns) and you’re told not to change code or add collectors, think: Cloud Logging + logs-based metrics + Cloud Monitoring dashboards/alerts. Also remember to choose counter vs distribution metrics appropriately and use 1-minute alignment for per-minute visualization.

4
Question 4

Your team runs a CI pipeline that executes ~200 integration test jobs per day, and each job must call internal gRPC APIs that are reachable only on 10.20.0.0/16 in a Shared VPC with no external IPs or NAT; the security policy requires that test traffic must never traverse the public internet, you are not allowed to maintain bastion hosts or custom proxies, tests must finish within 10 minutes per run, and you want the least operational overhead for setup and ongoing management—what should you do?

Cloud Build Private Pools run build steps on workers that are provisioned inside your VPC subnet with private IPs. Attaching the pool to the Shared VPC subnet allows direct private routing to 10.20.0.0/16 gRPC APIs without external IPs, NAT, bastions, or custom proxies. This is the lowest-ops approach and avoids per-run VM provisioning overhead, helping keep each test run under 10 minutes.

Creating a Compute Engine VM per build can keep traffic private, but it increases operational overhead: VM provisioning time, image maintenance/hardening, startup-script reliability, quota management, and cleanup logic. It also risks exceeding the 10-minute test window due to bootstrapping and dependency installation. This approach is more complex than using a managed Private Pool designed specifically for private CI execution.

An internal HTTPS Application Load Balancer is not a fit for gRPC-only private APIs unless you redesign the front end and still ensure private connectivity from the runner. Cloud Build’s default workers are not in your VPC, so allowing access via firewall rules is insufficient because the source is not your private subnet. This also adds load balancer configuration and does not directly address the no-public-internet constraint for the runner path.

A global external HTTPS Load Balancer explicitly exposes the service to the public internet, which violates the requirement that test traffic must never traverse the public internet. Cloud Armor can restrict access, but it does not make the path private; it only filters public traffic. This option also increases attack surface and operational complexity and is therefore the least aligned with the stated security policy.

Question Analysis

Core Concept: This question tests secure CI connectivity to private services using Cloud Build networking. The key capability is Cloud Build Private Pools, which let build workers run in your VPC with private IPs, enabling private east-west access to internal endpoints without public internet traversal. Why the Answer is Correct: Cloud Build’s default workers run on Google-managed infrastructure and typically reach targets over public egress unless you add special connectivity. Here, the APIs are only reachable inside 10.20.0.0/16 in a Shared VPC, with no external IPs and no NAT, and policy forbids public internet paths and forbids maintaining bastions/proxies. A Private Pool attached to the Shared VPC subnet places the build execution environment directly inside the private network, so gRPC calls route privately within the VPC/Shared VPC (and across regions if the VPC is global and routing/firewalls allow). This meets the 10-minute runtime requirement because tests run directly from the pool workers without extra VM provisioning steps. Key Features / Configurations: - Create a Cloud Build Private Pool in the service project and attach it to the appropriate Shared VPC subnet (host project) with Private Service Connect/Shared VPC permissions as required. - Ensure firewall rules allow pool worker IP ranges (the subnet range) to reach the gRPC backends on required ports. - Use least privilege IAM: Cloud Build service account permissions for pool usage and any API access. - Aligns with Google Cloud Architecture Framework security principles: private connectivity, minimize exposure, and reduce operational burden. Common Misconceptions: - “Just create ephemeral VMs per build” sounds private, but it adds provisioning time, quota management, image hardening, and lifecycle complexity. - “Put a load balancer in front” can improve access patterns, but it doesn’t solve the requirement that traffic must never traverse the public internet, and it introduces additional components and policy exceptions. Exam Tips: When you see Cloud Build needing access to private RFC1918-only services with strict no-public-internet requirements, think Private Pools. Also note Shared VPC constraints: you must attach the pool to the correct subnet and ensure firewall/IAM are configured. Prefer managed solutions that reduce operational overhead and meet latency/time-to-run constraints.

5
Question 5

A biotech company aggregates container and application logs from 15 Google Cloud projects into a single Cloud Logging bucket in a dedicated observability project using aggregated sinks with a 30-day retention policy. Compliance requires that each of the 8 product squads can only view logs originating from their own project(s), while the SRE team must be able to view all logs across all projects. You must implement least-privilege access, avoid duplicating data, and minimize ongoing costs and operational overhead. What should you do?

Incorrect. Granting Logs Viewer on the central bucket’s _Default view would allow each squad to query all logs stored in that bucket, including other squads’ projects, violating compliance. Granting Logs Viewer on the observability project to SRE is fine for broad access, but the squad access model is not least privilege because the default view is not filtered.

Incorrect. Custom IAM roles can limit which Logging permissions a squad has, but they cannot restrict which log entries are visible within a shared bucket. The requirement is data-level separation (only logs from certain project IDs). That is achieved with log views (filtered views), not by custom roles or by restricting access in the source projects once logs are centralized.

Correct. Create one log view per squad in the central bucket with a filter that matches only that squad’s project IDs, then grant roles/logging.viewAccessor on that view. This enforces least-privilege visibility without duplicating logs. Grant SRE access to a broad view such as _AllLogs to query across all projects. This minimizes cost and operational overhead while meeting compliance.

Incorrect. Exporting to separate BigQuery datasets duplicates data and increases cost (BigQuery storage and query costs) and operational overhead (multiple sinks/datasets/permissions). Also, granting Logs Writer to SRE is unrelated to viewing logs and violates least privilege. This option solves access separation but not the “avoid duplicating data” and “minimize costs/overhead” requirements.

Question Analysis

Core concept: This question tests centralized Cloud Logging with aggregated sinks, and how to enforce least-privilege read access when multiple source projects write into a single log bucket. The key feature is Cloud Logging log views (bucket views) combined with IAM (Logs View Accessor) to scope what users can query without duplicating log data. Why the answer is correct: With aggregated sinks, all logs land in one bucket in the observability project. If you grant access at the bucket’s default view, users can query all entries in that bucket. To meet compliance, each squad must only see logs from its own project(s) while SRE can see everything. Creating a separate log view per squad with a filter on resource.labels.project_id (or logName/project) restricts the visible log entries at query time. Granting each squad only roles/logging.viewAccessor on its specific view enforces least privilege. SRE can be granted access to a broad view (commonly _AllLogs) to query across all logs. Key features / best practices: - Log buckets provide retention controls (already 30 days) and centralized storage. - Log views provide filtered, named subsets of a bucket without copying data, aligning with the Google Cloud Architecture Framework security principle of least privilege. - IAM binding at the view level (roles/logging.viewAccessor) is the intended mechanism for multi-tenant log access in a shared bucket. - This approach minimizes cost and overhead: no extra exports, no duplicate storage, and only lightweight view/IAM management. Common misconceptions: Many assume project-level Logs Viewer on the observability project is sufficient, but that would expose all centralized logs. Others try to solve with custom roles; however, custom roles cannot enforce per-project row-level filtering inside a shared bucket—views do. Exam tips: When you see “central logging bucket” + “different teams can only see their own logs” + “avoid duplication,” think: Cloud Logging bucket views + roles/logging.viewAccessor. Exports to BigQuery/Storage are for analytics/archival, not primary least-privilege viewing, and they increase cost and operational complexity.

Want to practice all questions on the go?

Download Cloud Pass — includes practice tests, progress tracking & more.

6
Question 6

Your team operates a high-throughput webhook processor on Cloud Run (fully managed) in us-central1 with min instances set to 0, max instances set to 40, request concurrency set to 80, and container limits of 1 vCPU and 1 GiB memory; over the last 14 days peak traffic reached 2,500 RPS with p95 latency under 300 ms, and you need to accurately identify actual container CPU and memory utilization per revision to right-size resources and reduce Cloud Run costs by at least 20% without changing application code; which tool should you use to get these utilization metrics across all revisions?

Cloud Trace is designed for distributed tracing: it shows end-to-end request latency and where time is spent across services. It can help diagnose slow requests and identify bottlenecks, but it does not provide authoritative container CPU and memory utilization metrics per Cloud Run revision. Trace data is request-sampled and is not the right source for capacity/right-sizing decisions across all revisions.

Cloud Profiler provides code-level profiling (CPU time, heap, allocations) and is useful to optimize application performance. However, it is not the primary tool for container resource utilization metrics (CPU/memory usage vs limits) across Cloud Run revisions. Also, Cloud Run fully managed does not rely on installing an Ops Agent in the runtime the way VM-based workloads do, making this option mismatched to the requirement.

Cloud Monitoring is the correct tool because Cloud Run exports built-in metrics for container CPU and memory utilization and supports filtering/grouping by revision. You can use Metrics Explorer to view utilization over time, group by revision_name, and build dashboards to compare revisions. This enables accurate right-sizing (adjust CPU/memory limits, concurrency, min/max instances) to reduce costs without changing application code.

Logs-based metrics can count occurrences of log patterns and extract numeric fields from logs, but they are not a reliable way to measure actual container CPU and memory utilization. They also depend on the application emitting the right log data, which the question forbids changing. Even with existing logs, inferring utilization is indirect and error-prone compared to Cloud Monitoring’s native Cloud Run metrics.

Question Analysis

Core Concept: This question tests Cloud Run observability for resource right-sizing and cost optimization. Specifically, it asks how to obtain accurate container CPU and memory utilization per revision across a Cloud Run service, which is done through Cloud Monitoring (part of Google Cloud Observability). Why the Answer is Correct: Cloud Monitoring provides first-class, built-in metrics for Cloud Run (fully managed), including container CPU and memory utilization, request counts, instance counts, and latency. These metrics are emitted automatically without changing application code and can be filtered and grouped by resource labels such as service name and revision name. That makes it the correct tool to quantify actual utilization per revision over time, compare revisions (e.g., after config changes), and identify over-provisioning (e.g., 1 vCPU/1 GiB when p95 latency is already low). Key Features / How You’d Use It: In Metrics Explorer, select Cloud Run Revision / Cloud Run Service metrics (e.g., container CPU utilization and container memory utilization). Then group by “revision_name” (and optionally “service_name”) to see utilization across all revisions. Build a dashboard to track peak/average utilization and correlate with request rate and instance count. This supports right-sizing decisions (CPU/memory limits, concurrency, min/max instances) aligned with the Google Cloud Architecture Framework’s cost optimization and operational excellence pillars. You can also create alerting policies to catch regressions after changing limits. Common Misconceptions: Trace and Profiler are often associated with performance, but they do not provide authoritative container-level utilization metrics across revisions for Cloud Run. Logs-based metrics can approximate behavior but are not reliable for CPU/memory utilization and depend on application logging (which you cannot change). Exam Tips: For “utilization metrics” on managed compute (Cloud Run, GKE, Compute Engine), default to Cloud Monitoring. Use Trace for request latency breakdowns, Profiler for code-level CPU/heap hotspots, and logs-based metrics for counting log events—not for infrastructure utilization. When the question emphasizes “across revisions” and “no code changes,” think Monitoring with label-based filtering/grouping and dashboards.

7
Question 7

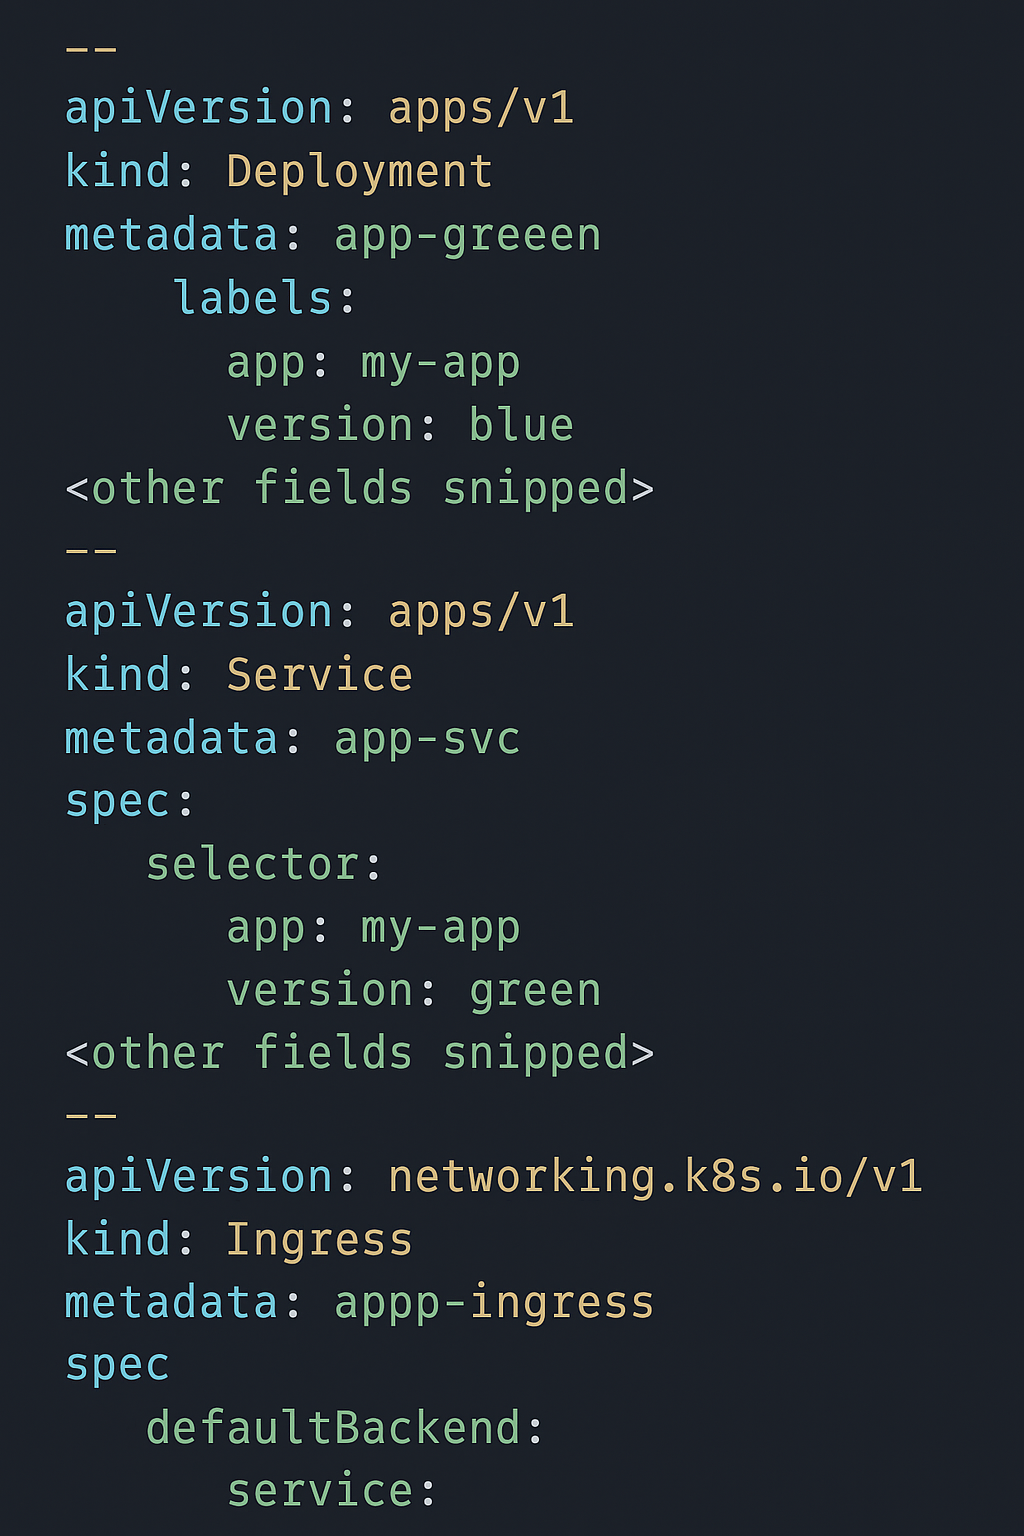
You are responsible for a customer-facing booking service deployed on Google Kubernetes Engine (GKE) using a blue/green deployment approach. The manifests include two Deployments (app-green and app-blue), a Service (app-svc), and an Ingress that routes traffic to the Service, as shown in the provided configuration. After updating app-green to the latest release, users report that most booking requests are failing in production, even though the release passed all pre-production tests. You must quickly restore service availability while giving developers a chance to debug the failing release. What should you do?

Updating app-blue to the new version defeats the purpose of blue/green rollback. If the new release is causing failures, promoting it to blue will likely increase blast radius by making both environments run the bad version. It also removes the last known-good deployment, making recovery harder and increasing time to restore service availability.

Rolling back app-green to the previous stable version could restore service, but it is not the fastest and it reduces developers’ ability to debug the failing release because you overwrite the problematic Pods. Blue/green is designed to keep the failing version deployed (green) while shifting traffic back to stable (blue) for immediate mitigation.

Changing the Service selector to only app: my-app would select Pods from both blue and green Deployments (assuming both share app: my-app). This effectively becomes an uncontrolled canary/split traffic scenario, which can continue to cause user-facing errors and create inconsistent behavior. It also complicates debugging and violates the goal of quickly restoring availability.

Changing the Service selector to app: my-app, version: blue is the classic blue/green traffic flip. It immediately routes all production traffic (Ingress -> Service) to the stable blue Pods, restoring availability quickly. The failing green release can remain running and isolated for developers to debug, preserving logs, metrics, and runtime state.

Question Analysis

Core Concept: This question tests blue/green deployment mechanics on GKE using Kubernetes labels/selectors. In a typical blue/green setup, two Deployments run side-by-side (blue = stable, green = candidate). Traffic is shifted by changing which set of Pods a stable endpoint (Service/Ingress) targets. The Ingress routes to a Service; the Service selects Pods via labels. Why the Answer is Correct: The provided manifests show a mismatch: the Deployment named app-green is labeled version: blue, while the Service app-svc selects version: green. After updating app-green to the latest release, production traffic (via Ingress -> Service) is still routed to Pods matching version: green. If the “green” Pods are the newly updated (and failing) release, the fastest way to restore availability while keeping the failing release running for debugging is to switch the Service selector back to the known-good environment (blue). Option D does exactly that by setting the Service selector to app: my-app, version: blue, immediately shifting all production traffic to the blue Pods without deleting or rolling back the green Deployment. Key Features / Best Practices: Kubernetes Services provide stable virtual IP/DNS and select endpoints dynamically via label selectors. In blue/green, you keep both versions deployed and flip traffic by changing selectors (or by using separate Services and switching Ingress backends). This aligns with SRE practices: fast rollback/mitigation to restore SLOs, while preserving the failed version for investigation. It also supports the Google Cloud Architecture Framework’s reliability principle: design for quick recovery and controlled change. Common Misconceptions: A rollback by redeploying (option B) can work but is slower and removes the ability to inspect the failing version in situ. Updating blue to the new version (option A) spreads the failure. Broadening selectors (option C) can unintentionally send traffic to both versions, creating inconsistent behavior and making debugging harder. Exam Tips: When you see Ingress -> Service -> Pods, remember: traffic shifting is usually done at the Service selector layer. For blue/green, the safest “restore now” action is to repoint traffic to the stable color, leaving the broken color running for debugging and postmortem data collection.

8
Question 8
(Select 2)

You are setting up an automated container image build in Cloud Build for a payment reconciliation microservice. The source code is hosted in Bitbucket Cloud. Your compliance policy mandates that production-grade images must be built only from the release/v1 branch, and that all merges into release/v1 must be explicitly approved by the governance group with at least two approvers. You want the process to be as automated as possible while meeting these requirements. What should you do? (Choose two.)

A pull request trigger can be useful for running tests on proposed changes, but it does not meet the requirement that production-grade images be built only from release/v1. PR builds often run on the PR’s source branch or a temporary merge ref and may produce artifacts from code that never gets merged. This is good for validation, not for controlled production image creation.

Included files filters limit when a trigger runs based on changed file paths, not on governance approvals or branch merge policy. Adding CODEOWNERS to an included files filter is also conceptually incorrect: CODEOWNERS is interpreted by the VCS for review rules, not by Cloud Build for authorization. This would not ensure two governance approvals nor restrict builds to release/v1.

A push-to-branch trigger filtered to release/v1 directly enforces that the automated image build occurs only when code is pushed/merged into the release/v1 branch. This is the most automated way to ensure production images are built from the correct branch tip. It also reduces risk of building from feature branches or PR refs and aligns with controlled release workflows.

Bitbucket branch protection on release/v1 is the correct place to enforce “at least two approvers” and “explicitly approved by the governance group before merge.” This prevents noncompliant changes from landing in the protected branch at all. It is a preventative control (shift-left) and complements the Cloud Build trigger so that only compliant merges can trigger production builds.

Cloud Build trigger approvals add a manual gate before a build executes, but they do not enforce that merges into release/v1 have two governance approvals. Approval in Cloud Build is typically used for promoting deployments or sensitive steps, not for satisfying VCS merge-approval policies. It also reduces automation and can be bypassed if builds are triggered elsewhere.

Question Analysis

Core Concept: This question tests CI/CD governance controls across two systems: (1) Cloud Build triggers to ensure production images are built only from an allowed source branch, and (2) source-control enforcement (Bitbucket) to ensure merges into that branch meet an approval policy. In regulated environments, the strongest control is to enforce policy at the earliest point (the VCS) and then automate downstream builds. Why the Answer is Correct: You must guarantee that production-grade images are built only from release/v1. The most direct and automatable way is a Cloud Build trigger that fires on pushes to the release/v1 branch (Option C). This ensures the build pipeline only runs when code actually lands in the controlled branch, rather than on arbitrary branches or unmerged pull requests. Separately, the compliance requirement is that all merges into release/v1 are explicitly approved by the governance group with at least two approvers. That control belongs in Bitbucket branch protection (Option D), which can require a minimum number of approvals and restrict who can approve/merge. This prevents non-compliant code from ever reaching release/v1, which is stronger than trying to “catch” violations during build. Key Features / Best Practices: - Cloud Build trigger filtering: configure “Push to a branch” and set the branch regex to match only release/v1. This aligns with least privilege and reduces accidental production builds. - Bitbucket branch permissions/protection: require 2 approvals, enforce review from a specific group (governance), and optionally restrict direct pushes to release/v1. - Architecture Framework alignment: governance and security controls should be preventative (shift-left) and automated; CI should be deterministic and tied to immutable, controlled sources. Common Misconceptions: - Using PR triggers (Option A) can build unmerged code and does not guarantee the image corresponds to what is actually released. - Cloud Build “Approval” (Option E) is a manual gate for the build execution, not a governance control over merges into the branch; it also adds operational friction and doesn’t ensure two approvers from a specific group. Exam Tips: When requirements mention “all merges into branch X must be approved,” look first to VCS branch protection. When requirements mention “build only from branch X,” look to CI trigger branch filters. Prefer controls that prevent noncompliance rather than detect it later.

9
Question 9

You operate a high-frequency IoT telemetry ingestion service on Google Kubernetes Engine with separate production and staging clusters, each in its own VPC network; within each VPC, the API gateway nodes and stream processing nodes run on different subnets (api-subnet and proc-subnet), and a security analyst suspects an intermittent malicious beacon originating from the production API gateway nodes that occurs a few times per hour and lasts under 10 seconds, and you need to ensure network flow data is captured for forensic analysis without delaying the investigation; what should you do?

Enabling Flow Logs only on the production subnets is correctly scoped and avoids staging noise, but a sample volume scale of 0.5 can miss short, intermittent beacons that last under 10 seconds. For forensic investigations, missing even a few flows can prevent attribution or timeline reconstruction. This option optimizes cost/volume too early at the expense of evidence completeness.

This is the best choice: it enables VPC Flow Logs immediately where the suspected traffic originates and traverses (production api-subnet and proc-subnet) and uses sample volume scale 1.0 to maximize the chance of capturing brief beacon activity. It aligns with incident-response priorities (speed and completeness) while keeping scope limited to production to reduce unnecessary log volume.

Rolling out to staging first delays data collection in production, which conflicts with “without delaying the investigation.” Also, enabling Flow Logs on staging doesn’t help capture evidence for a production-originating beacon and increases log volume and analysis noise. Finally, 0.5 sampling still risks missing short-lived flows, undermining the forensic goal.

Although sample volume scale 1.0 is appropriate for capturing short beacons, enabling staging as well as production adds cost and noise without improving production forensics. More importantly, a staging-first rollout delays production capture, which is explicitly disallowed by the requirement to avoid delaying the investigation.

Question Analysis

Core Concept: This question tests VPC Flow Logs as an observability and forensics tool. VPC Flow Logs capture metadata about network flows (5-tuple, bytes, packets, start/end times, direction, etc.) for VM NICs in a subnet, including GKE node traffic, and export to Cloud Logging for near-real-time investigation. Why the Answer is Correct: You have a suspected intermittent malicious beacon from production API gateway nodes that occurs only a few times per hour and lasts under 10 seconds. With such short-lived events, sampling is the key risk: if you sample at 0.5, you can miss the exact flows you need for forensic correlation. Enabling Flow Logs on the production subnets involved (api-subnet and proc-subnet) with sample volume scale 1.0 maximizes capture probability immediately, without waiting for a staged rollout. The requirement explicitly says “without delaying the investigation,” which argues against staging-first changes. Key Features / Configurations: - Subnet-level enablement: Flow Logs are configured per subnet, so enabling on api-subnet and proc-subnet targets the relevant node pools and east-west traffic paths. - Sampling (sample volume): 1.0 captures all eligible flows, best for short, intermittent beacons. - Log availability: exported to Cloud Logging, enabling rapid querying, alerting, and export to BigQuery/SIEM. - Cost/volume tradeoff: 1.0 increases log volume and cost; however, for urgent forensics, completeness outweighs cost. You can later reduce sampling or narrow subnets once the incident is understood. Common Misconceptions: - “Always roll out to staging first”: good SRE practice for risky changes, but here the change is observability-only and time-sensitive; delaying reduces the chance of capturing the beacon. - “Enable on both VPCs for completeness”: the suspected source is production API nodes; enabling staging adds cost/noise and doesn’t improve evidence collection for the production incident. Exam Tips: - For incident response and short-lived network anomalies, prioritize capture fidelity (higher sampling) and speed. - Remember Flow Logs are subnet-scoped; choose the smallest scope that still captures the suspected source and relevant paths. - Tie decisions to the Google Cloud Architecture Framework: observability and security posture, balanced with cost optimization after the immediate need is met.

10
Question 10

You are the on-call SRE for a live trivia streaming platform running on Google Kubernetes Engine (GKE) behind a global external HTTP(S) Load Balancer with geo-based routing; each of 4 regions (us-central1, europe-west1, asia-southeast1, southamerica-east1) contains 3 regional GKE clusters serving traffic via NEG backends, and at 18:05 UTC you receive a page that asia-southeast1 users have had 100% connection failures (HTTP 502) for the past 7 minutes while other regions are healthy and asia-southeast1 normally serves 25% of global requests and the availability SLO is 99.95% monthly with a rapid burn alert firing; you want to resolve the incident following SRE best practices. What should you do first?

Correct. This is the quickest, safest mitigation to reduce user impact and error-budget burn: remove asia-southeast1 from the serving path (disable/drain backends or adjust weights) so traffic goes to healthy regions. It leverages the global external HTTP(S) Load Balancer’s multi-region design and is reversible. After service is stabilized, you can investigate the asia-southeast1 root cause.

Checking CPU/memory can help diagnose whether the region is overloaded, but it does not immediately restore availability for users currently seeing 502s. Also, 100% 502s across a region often indicates a broader failure (health check, networking, ingress/proxy, endpoint readiness) rather than just resource saturation. In SRE response, mitigation comes before deep metric analysis.

Adding large node pools is a slow, potentially expensive change and is not a first-response action during an active outage. It assumes capacity is the root cause, which is not supported by the symptom (HTTP 502 across the region). Scaling may not fix misconfigurations, network failures, or load balancer/NEG health issues. Prefer traffic shift first, then targeted remediation.

Logs are valuable for root cause analysis (e.g., ingress/controller errors, upstream resets, TLS issues), but they are not the first step when a regional outage is causing total failures and rapid SLO burn. SRE best practice is to mitigate user impact first (traffic reroute), then use logs/metrics/traces to diagnose and implement a permanent fix.

Question Analysis

Core concept: This question tests incident response under SRE principles: prioritize user impact reduction, protect the error budget, and restore service quickly using safe, reversible mitigations. It also touches global external HTTP(S) Load Balancing with geo-based routing and NEG backends, where a single region can be isolated without taking down the whole service. Why the answer is correct: With 100% connection failures (HTTP 502) for asia-southeast1 for 7 minutes and a rapid burn alert firing against a 99.95% monthly SLO, the first action should be to mitigate customer impact immediately. Disabling/draining the asia-southeast1 backends (or adjusting traffic steering so that region receives 0% traffic) is a fast, low-risk mitigation that restores availability for affected users by sending them to the nearest healthy regions. This aligns with SRE best practice: stop the bleeding first, then investigate root cause. It also buys time to troubleshoot without continuing to burn error budget. Key features / best practices: Global external HTTP(S) Load Balancer supports multi-region backends with health checks and traffic steering. If a region is returning 502s, removing it from serving (or setting failover/weights) reduces errors immediately. Using NEGs with GKE makes backend health dependent on endpoint readiness and health checks; a regional issue (control plane, networking, misconfig, certificate, Envoy/Ingress, etc.) can cause widespread 502s. SRE playbooks typically start with mitigation steps (traffic shift, rollback, feature flag off) before deep debugging. Common misconceptions: It’s tempting to start with logs/metrics (B/D) because they help find root cause, but they don’t immediately reduce user-visible errors. Another trap is assuming capacity (C) is the issue; 502s often indicate backend unavailability, misrouting, or proxy/upstream failures rather than simple CPU/memory pressure, and scaling can be slow and may not fix the underlying fault. Exam tips: When you see “rapid burn,” “100% failures,” and “other regions healthy,” choose the fastest reversible mitigation that restores service (traffic shift/disable bad region) before detailed troubleshooting. Map actions to SRE priorities: mitigate impact, stabilize, then diagnose and prevent recurrence. Also remember that global load balancers are designed for regional isolation and failover—use that capability during incidents.

Want to practice all questions on the go?

Download Cloud Pass — includes practice tests, progress tracking & more.

11
Question 11

Your retail analytics team is deploying a webhook service on Cloud Run that ingests inventory updates and uses the OpenTelemetry SDK with a BatchSpanProcessor to export traces to Cloud Trace every 5 seconds. Under light traffic (<1 request/second), about 30% of spans never appear in Cloud Trace even though requests return HTTP 200. The service is configured with min instances = 0, concurrency = 80, memory = 1 GiB, and 2 vCPU, and CPU is currently set to be allocated only during request processing. You must ensure reliable trace export without changing application code or adding external components. What should you do?

An HTTP health check can reduce cold starts by generating traffic, but it does not directly solve the root cause: lack of CPU cycles when the instance is idle. Even if the instance stays up, Cloud Run can still withhold CPU between requests when configured for request-only CPU, preventing the BatchSpanProcessor’s periodic export timer from running reliably. It also adds artificial traffic and cost without guaranteeing trace flushing.

Correct. Configuring Cloud Run for CPU always allocated ensures background threads and timers continue to run outside active request handling. The OpenTelemetry BatchSpanProcessor depends on periodic execution to flush spans every 5 seconds; with request-only CPU and low traffic, the exporter may not run before the instance is suspended or terminated. Always-on CPU is the intended Cloud Run setting for background processing and reliable telemetry export.

Increasing CPU from 2 vCPU to 4 vCPU improves throughput during active request processing, but it does not address spans missing under light traffic. The issue occurs when there are no requests and CPU is not allocated at all, so the exporter’s scheduled flush cannot execute. More vCPU during requests won’t help if the exporter needs CPU time during idle periods to send buffered spans.

Cloud Trace ingestion may retry transient network failures, but here the spans often never leave the process because the batch exporter doesn’t get CPU time to run its periodic flush. If the instance is suspended or terminated with spans still buffered in memory, there is nothing to retry. Relying on retries is not a reliability strategy for telemetry that is never exported from the application runtime.

Question Analysis

Core concept: This question tests Cloud Run execution semantics (request-based CPU vs always-on CPU) and how background telemetry exporters (OpenTelemetry BatchSpanProcessor) behave in serverless environments. It also touches observability reliability: ensuring spans are flushed before an instance is throttled or terminated. Why the answer is correct: With Cloud Run configured to allocate CPU only during request processing, the container gets CPU time only while actively handling an HTTP request. The OpenTelemetry BatchSpanProcessor exports on a timer (every 5 seconds). Under light traffic (<1 rps), there are long idle gaps between requests. During those idle periods, Cloud Run may not allocate CPU, so the scheduled export/flush loop may not run. If the instance becomes idle and is frozen or terminated (min instances = 0 increases the chance of scale-to-zero), spans buffered in memory may never be exported even though the request returned 200. Setting CPU to “always allocated” ensures the exporter’s periodic task can run even when no requests are in flight, allowing the batch processor to flush spans reliably. Key features / best practices: Cloud Run’s “CPU allocation” setting is specifically designed for workloads that need background processing (metrics/trace exporters, async queues, periodic tasks). Always-on CPU is a standard mitigation when you cannot change code to force a flush at end-of-request. This aligns with Google Cloud Architecture Framework observability guidance: design telemetry pipelines so they are resilient to platform lifecycle events (scale-to-zero, instance shutdown) and avoid losing buffered telemetry. Common misconceptions: Keeping the service “warm” via health checks (Option A) may reduce scale-to-zero but does not guarantee CPU time between requests; the core issue is CPU throttling when idle, not just cold starts. Increasing vCPU (Option C) doesn’t help if CPU is not allocated at all during idle. Relying on retries (Option D) misunderstands the failure mode: spans are never exported, so there is nothing to retry. Exam tips: For Cloud Run + OpenTelemetry/agents/exporters that flush on timers, remember: request-only CPU can drop background work. If you can’t modify code to flush synchronously, choose “CPU always allocated” (and consider min instances for latency, not for exporter correctness).

12
Question 12

Your fintech startup operates three GKE Autopilot clusters (dev, staging, prod) across us-central1 and europe-west4 and uses a GitOps workflow with a single Git repository per team. Product squads often need Google Cloud resources (for example, 12 Pub/Sub topics, 4 Cloud SQL instances, and multiple IAM bindings) to support their microservices. You must let engineers declare these resources as code from within their Kubernetes namespaces, enforce least-privilege access with Kubernetes RBAC, and have the system continuously reconcile desired state so that any manual console change is corrected within 10 minutes, following Google-recommended practices. What should you do?

Config Connector is the correct choice because it lets teams manage Google Cloud resources using Kubernetes CRDs inside their namespaces. Kubernetes RBAC controls who can apply/change these CRDs, and KCC continuously reconciles desired state, automatically correcting manual console drift. It aligns with GitOps workflows and supports least-privilege by mapping namespaces to dedicated Google Cloud service accounts/permissions (often via Workload Identity).

Cloud Build running Terraform can provision infrastructure from Git, but it is not Kubernetes-namespace-native. Engineers would not declare resources “from within their Kubernetes namespaces” as Kubernetes objects; they’d submit Terraform changes and rely on pipeline execution. Drift correction within 10 minutes is not automatic unless you add scheduled runs or external drift detection, and least-privilege per namespace is harder because Terraform typically uses shared credentials and state.

A long-running Pod executing Terraform is an anti-pattern for production GitOps and Autopilot operations. It lacks robust state management, secure credential handling, and governance. It also doesn’t provide Kubernetes-native CRDs for engineers to declare resources within namespaces, and continuous reconciliation/drift correction would require custom logic. Autopilot also constrains node-level operations; running ad-hoc infra tooling in Pods increases operational risk.

A Kubernetes Job running Terraform is better than a Pod for one-off execution, but it still doesn’t meet the requirement for continuous reconciliation within 10 minutes unless you add a CronJob or external scheduler. It also doesn’t provide namespace-scoped, Kubernetes-native resource declarations with RBAC boundaries the way Config Connector does. Terraform state, locking, and credentials remain complex in a multi-team, multi-cluster setup.

Question Analysis

Core Concept: This question tests Kubernetes-native infrastructure management on Google Cloud using GitOps principles. The key service is Config Connector (KCC), which exposes Google Cloud resources as Kubernetes Custom Resources (CRDs) and reconciles them continuously, aligning with the Google Cloud Architecture Framework principles of automation, least privilege, and operational excellence. Why the Answer is Correct: You need engineers to declare Google Cloud resources “from within their Kubernetes namespaces,” enforce least privilege with Kubernetes RBAC, and continuously reconcile drift within ~10 minutes. Config Connector is purpose-built for this: teams apply YAML manifests (e.g., Pub/SubTopic, SQLInstance, IAMPolicyMember) in their namespace, and KCC’s controllers create/update the corresponding Google Cloud resources. Drift correction is inherent to the controller reconciliation loop—manual console changes are reverted automatically without requiring an external pipeline run. Key Features / Configurations: - Namespace-scoped management: Use KCC’s namespace mode so each squad manages only resources mapped to its namespace. - Least privilege: Combine Kubernetes RBAC (who can create/update CRDs in a namespace) with Google Cloud IAM via a dedicated service account per namespace/team (often via Workload Identity) granting only required permissions (e.g., pubsub.admin on specific projects or folders, cloudsql.admin where needed). - Continuous reconciliation: Controllers regularly reconcile desired vs actual state, meeting the “correct within 10 minutes” requirement. - GitOps fit: Store CRDs in the same team repo and let your GitOps tool (e.g., Config Sync/Argo CD/Flux) apply them; KCC then handles cloud resource lifecycle. Common Misconceptions: Terraform-based options (Cloud Build, Pod, Job) can provision resources, but they are not Kubernetes-native per-namespace APIs and do not inherently provide continuous drift reconciliation unless you build additional scheduling/automation. They also complicate least-privilege at the namespace level because Terraform typically runs with broader credentials and state management. Exam Tips: When you see “manage Google Cloud resources via Kubernetes manifests,” “namespace isolation,” and “continuous reconciliation,” think Config Connector. Terraform is excellent for centralized IaC, but KCC is the Google-recommended pattern for Kubernetes-centric, multi-tenant, GitOps-driven resource management with RBAC boundaries.

13
Question 13

You are planning capacity for a real-time video engagement analytics platform ahead of an international rollout; the platform runs entirely in containers on Google Kubernetes Engine (GKE) Standard using a regional cluster in asia-southeast1 across three zones with the cluster autoscaler enabled, you forecast 10% month-over-month user growth over the next six months, current steady-state workload consumes about 28% of total deployed CPU capacity, and the service must remain resilient to the loss of any single zone; you want to minimize user impact from either growth or a zonal outage while avoiding unnecessary spend; how should you prepare to handle the predicted growth?

Correct. This approach addresses both growth and zonal failure by ensuring autoscaling can actually occur (node pool max size and regional quotas), ensuring pods scale correctly (HPA with right requests/limits), and validating behavior with representative load tests including a simulated zone loss. It minimizes user impact while avoiding unnecessary spend because it relies on elastic scaling validated by testing rather than permanent overprovisioning.

Incorrect. Cluster Autoscaler is not a guarantee of unlimited scaling: it is constrained by node pool max size, regional quotas (vCPU, IP addresses, etc.), and can be slowed by provisioning time. Also, without properly set pod requests/limits and HPA, the system may not scale pods appropriately, leading to pending pods or poor binpacking. It also doesn’t validate N+1 capacity for a zonal outage.

Incorrect. 28% steady-state utilization doesn’t ensure six months of safety because 10% month-over-month growth compounds to ~77% over six months. More importantly, resilience to losing one zone means the remaining zones must absorb load; per-zone capacity and scheduling constraints can cause hotspots even when overall utilization looks low. This option ignores quota ceilings and provides no validation through load/failure testing.

Incorrect. Pre-provisioning 60% additional node capacity now is not the best approach because six months of 10% month-over-month growth compounds to about 77%, so 60% is not even a precise match for the forecasted increase. More importantly, buying capacity up front increases cost immediately and still does not verify that autoscaling limits, quotas, pod requests, and scheduling behavior will work correctly during a real surge or a single-zone failure. The better practice is to validate node pool maximums and quotas, configure HPA and resource requests properly, and run representative load and failure tests so capacity can scale elastically instead of being statically overprovisioned.

Question Analysis

Core concept: This question tests capacity planning for GKE Standard with autoscaling, specifically balancing reliability (N+1 across zones) and cost efficiency. It also touches on Kubernetes resource requests/limits, Horizontal Pod Autoscaler (HPA), Cluster Autoscaler, and Google Cloud quota planning. Why the answer is correct: Option A is the only choice that prepares for both predictable growth and a zonal outage while avoiding unnecessary spend. With a regional cluster across three zones, resilience to loss of one zone implies you must ensure the remaining two zones can carry the full workload (or at least maintain SLOs with graceful degradation). Today’s 28% CPU utilization is against total deployed capacity, but that doesn’t automatically translate to “safe headroom” because (1) growth compounds (~1.1^6 ≈ 1.77, ~77% increase), (2) capacity is distributed per-zone, and (3) pod scheduling constraints, requests, and HPA behavior determine whether capacity is actually usable during spikes or failures. Validating max node pool size and regional quotas ensures autoscaling can actually add nodes when needed. Key features / best practices: - HPA scales pods based on metrics; it requires accurate CPU/memory requests to make scaling decisions and to allow binpacking. - Cluster Autoscaler adds/removes nodes when pods are pending due to insufficient resources; it is bounded by node pool max size and project/region quotas (CPU, IPs, etc.). - Load testing (including simulating a single-zone loss) validates real capacity under disruption and confirms PodDisruptionBudgets, topology spread constraints, and anti-affinity rules behave as intended. - Aligns with Google Cloud Architecture Framework: reliability (design for failure), performance (validate under load), and cost optimization (avoid overprovisioning). Common misconceptions: It’s tempting to assume autoscaler “handles everything” (B) or that 28% utilization means ample headroom (C). Both ignore quota ceilings, per-zone failure scenarios, and misconfigured requests/limits that can prevent scaling or cause inefficient node usage. Pre-provisioning large capacity (D) reduces risk but wastes money and still doesn’t prove the system meets SLOs during a zonal outage. Exam tips: For GKE scaling questions, look for answers that combine: (1) correct autoscaling layers (HPA + Cluster Autoscaler), (2) quota and max-size validation, and (3) empirical validation via load testing and failure testing. Regional resilience questions usually imply N+1 planning and testing with a zone removed.

14
Question 14

You lead a team building Cloud Run–based microservices for a fintech product. Each repository includes end-to-end integration tests under tests/e2e that deploy a temporary Cloud Run revision into the staging project svc-stg-001 and delete it after completion. Source control is GitHub, and feature branches follow the pattern feature/*. You must automatically run the integration tests on every pull request targeting the main branch and block merges until tests pass. Tests should run only when files under service/ or tests/e2e/ change, and each run must finish within 30 minutes. You want a managed, GCP-native solution to automate this workflow. What should you do?

Self-managed Jenkins on Compute Engine is not a managed, GCP-native approach and introduces significant operational overhead (patching, scaling, availability, security hardening). Scheduling every 6 hours fails the requirement to run on every pull request update and to block merges until tests pass. It also wastes resources by running regardless of whether relevant files changed and does not inherently integrate with GitHub required status checks without extra setup.

Manual local execution by reviewers is unreliable and not automatable. It cannot guarantee consistent environments, repeatability, or auditability, and it does not meet the requirement to automatically run tests on every PR update. It also cannot reliably block merges based on an enforced status check, because logs attached to a PR are not a verifiable CI signal and are prone to human error or omission.

Running tests only on pushes to main means tests execute after the pull request is merged, which violates the requirement to block merges until tests pass. This approach increases risk because broken changes can land in main and potentially trigger downstream deployments. It also doesn’t satisfy the requirement to run on every PR update, and it provides slower feedback to developers compared to PR-triggered CI.

Cloud Build GitHub App pull request triggers are managed and integrate directly with GitHub PR events. Path filters ensure builds run only when service/** or tests/e2e/** change, meeting the selective execution requirement and controlling cost. Setting the build timeout to 30 minutes enforces the runtime constraint. Requiring the Cloud Build status check in GitHub branch protection blocks merges until tests pass, fulfilling the gating requirement end-to-end.

Question Analysis

Core Concept: This question tests implementing PR-based CI with a managed, GCP-native service. The key services are Cloud Build (for CI execution), Cloud Build GitHub App triggers (for PR events), and GitHub required status checks (to block merges). It also tests selective execution via path filters and enforcing runtime limits via build timeouts. Why the Answer is Correct: Option D directly satisfies every requirement: it runs automatically on every pull request update targeting main, runs only when relevant paths change (service/** or tests/e2e/**), enforces a 30-minute maximum runtime via Cloud Build timeout, and blocks merges by requiring the Cloud Build status check to pass in GitHub branch protection rules. Cloud Build is fully managed (no servers), integrates natively with Google Cloud IAM, and can deploy ephemeral Cloud Run revisions into the staging project (svc-stg-001) using a dedicated service account with least privilege. Key Features / Configurations: 1) Cloud Build GitHub App PR trigger: listens to PR events (opened/synchronize/reopened) and targets main. 2) Path filters: include service/** and tests/e2e/** so unrelated doc/config changes don’t consume build minutes. 3) Build timeout: set to 30m to meet the hard execution constraint. 4) GitHub branch protection: require the Cloud Build check context to pass before merge. 5) Security and governance: use a Cloud Build service account scoped to deploy/delete Cloud Run revisions in staging; store secrets in Secret Manager; use Artifact Registry for images. This aligns with Google Cloud Architecture Framework principles (automation, least privilege, and reliable delivery). Common Misconceptions: A self-managed Jenkins (A) can implement this, but it violates “managed, GCP-native,” adds operational burden, and the 6-hour schedule doesn’t meet “every PR update.” Running locally (B) is not enforceable or auditable. Testing only after merge (C) is too late and does not block merges. Exam Tips: For DevOps exam questions, map requirements to trigger type (PR vs push), gating mechanism (required status checks), and efficiency controls (path filters, timeouts). When you see “managed” and “GCP-native,” prefer Cloud Build/Cloud Deploy over self-hosted CI, and ensure the solution explicitly blocks merges via GitHub branch protection or equivalent policy.

15
Question 15

Your retail analytics application runs on Cloud Run in us-central1 behind Cloud Load Balancing and depends on BigQuery and Cloud Storage; over the past week, P95 latency spiked from 180 ms to 3000 ms and 5xx errors peaked at 4.2% during three separate incidents. You need to build a Cloud Monitoring dashboard to troubleshoot and specifically determine whether the spikes are caused by your service or by outages/degradations in Google Cloud services you rely on (e.g., Cloud Load Balancing, BigQuery, Cloud Storage); what should you do?

Log-based metrics can quantify specific error patterns found in logs (for example, BigQuery API errors returned to your service). However, they reflect what your workloads logged, not whether Google Cloud had an underlying incident. They can also miss issues if logging is incomplete or sampling occurs. This helps symptom tracking, but it does not reliably attribute spikes to Google-managed service degradation.

A logs widget is useful for quickly viewing recent errors and stack traces during troubleshooting. But raw logs are noisy, require manual filtering, and still only show what your application or services emitted. They do not provide authoritative, curated incident context about Google Cloud service health. This approach is slower for correlation and does not directly answer whether Google Cloud dependencies were degraded.

Alerting policies notify you when a metric crosses a threshold, which is valuable for detection and SLO-based paging. But the question is about building a dashboard to determine causality (your service vs Google Cloud dependency outages). Alerting alone doesn’t provide attribution, and “system error metrics” are not a direct mechanism to correlate with Google Cloud service incidents affecting your project.

Personalized Service Health annotations add Google Cloud service incident/disruption markers to Cloud Monitoring dashboards, scoped to services and impacts relevant to your project. This enables immediate correlation between your latency/5xx spikes and dependency incidents in Cloud Load Balancing, BigQuery, or Cloud Storage. It is purpose-built for distinguishing platform/dependency degradations from application-level problems during incident triage.

Question Analysis

Core Concept: This question tests observability for dependency-related incidents: distinguishing application-caused latency/5xx from underlying Google Cloud service degradations. The key capability is correlating your metrics (Cloud Run, load balancer) with Google-managed service health signals inside Cloud Monitoring. Why the Answer is Correct: Personalized Service Health (PSH) provides project-specific, product-specific incident and disruption information for Google Cloud services you consume (for example, Cloud Load Balancing, BigQuery, Cloud Storage) and can surface relevant events as annotations on Cloud Monitoring dashboards. By enabling PSH annotations, you can visually correlate the exact time windows of your P95 latency spikes and 5xx error peaks with Google Cloud service incidents affecting your project/region. This directly answers the requirement: determine whether spikes are caused by your service or by outages/degradations in dependencies. Key Features / Best Practices: PSH annotations integrate into dashboards as time-based markers, enabling rapid “did something external happen?” triage. This aligns with Google Cloud Architecture Framework (Operational Excellence and Reliability) by improving mean time to detect/identify (MTTD/MTTI) and reducing toil during incident response. In practice, you would pair PSH annotations with charts for Cloud Run request latency, Cloud Run 5xx rate, HTTP(S) Load Balancer backend latency/5xx, and client-side BigQuery/Storage error/latency metrics to isolate whether failures originate upstream (Google service disruption) or within your service (code, scaling, cold starts, concurrency, timeouts). Common Misconceptions: It’s tempting to build log-based metrics or logs widgets, but those primarily show what your application observed (symptoms), not authoritative signals that Google Cloud itself had an incident impacting your project. Alerting on “system error metrics” also doesn’t provide the needed attribution; it notifies you that something is wrong but doesn’t explain whether the root cause is a platform dependency. Exam Tips: When the question explicitly asks to determine whether issues are due to Google Cloud service outages/degradations, look for PSH (and related service health/incident surfaces) rather than logs-only approaches. For DevOps exam scenarios, prioritize solutions that improve correlation and incident triage speed, not just detection.

Want to practice all questions on the go?

Download Cloud Pass — includes practice tests, progress tracking & more.

16
Question 16

Your video analytics platform is deploying a frame-processing microservice on both GKE Autopilot in us-central1 (200 pods across 5 namespaces) and 30 on-premises Linux servers in a private data center; you must collect detailed, function-level performance data (CPU and heap profiles) with under 5% overhead, keep profiles for 30 days, and visualize everything centrally in a single Google Cloud project without building or operating your own metrics pipeline—what should you do?

Cloud Profiler is the managed Google Cloud service for continuous, low-overhead CPU and heap profiling with function-level attribution. Installing the Profiler agent in both GKE Autopilot workloads and on-prem Linux services allows profiles to be uploaded to a single Cloud project for centralized visualization and analysis. This meets the <5% overhead goal and avoids building/operating a custom metrics pipeline; you mainly manage agent integration and IAM/network access.

Cloud Debugger is designed for inspecting application state (snapshots) and adding logpoints without redeploying, not for continuous CPU/heap profiling. Emitting debug logs with timing data increases logging volume and overhead, lacks statistically meaningful function-level CPU/heap attribution, and becomes a quasi-custom pipeline for performance analysis. It also doesn’t naturally provide aggregated profiling views over time comparable to Cloud Profiler.

Exposing a /metrics endpoint and using a timing library is closer to custom metrics collection than managed profiling. Cloud Monitoring uptime checks are for availability/endpoint checks and are not intended to scrape Prometheus-style metrics at scale across many pods/namespaces and on-prem servers. Even with Managed Service for Prometheus, you’d still be collecting metrics, not CPU/heap profiles with function-level attribution, and you’d be operating more instrumentation and ingestion components.

A third-party APM agent can provide profiling, but it violates the requirement to avoid building/operating your own metrics pipeline and adds operational complexity (agent management, licensing, data export, storage, and visualization). Exporting to a bucket/database for later analysis is not a managed, integrated profiling experience in Google Cloud and increases cost and maintenance. For the exam, prefer first-party managed observability services when requirements match.

Question Analysis

Core Concept: This question tests Google Cloud’s managed observability tooling for code-level performance profiling across hybrid environments. The key service is Cloud Profiler, which continuously collects statistical CPU and heap profiles from running applications with low overhead and stores/visualizes them centrally in a Google Cloud project. Why the Answer is Correct: You need function-level performance data (CPU and heap profiles), <5% overhead, 30-day retention, and a single centralized view in Google Cloud without operating a custom pipeline. Cloud Profiler is purpose-built for this: you integrate the Profiler agent into the application (or use supported language agents), and it uploads profiles to Cloud Profiler in your project. It works for workloads running on GKE (including Autopilot) and for on-prem Linux servers as long as they can authenticate to Google Cloud APIs (typically via service account credentials or workload identity federation) and reach the Profiler endpoint. This directly satisfies the “no pipeline to build/operate” requirement. Key Features / Configurations / Best Practices: - Low-overhead, continuous profiling: sampling-based profiling is designed to keep overhead typically well under 5%. - Profile types: CPU and heap (and others depending on language/runtime) provide function-level attribution. - Centralized visualization: profiles are aggregated and explored in the Cloud Profiler UI within one project, aligning with the Google Cloud Architecture Framework’s Operational Excellence and Reliability pillars (measure, observe, and improve). - Retention: Cloud Profiler retains profiles for analysis over time (commonly aligned with 30-day operational windows), enabling regression detection. - Hybrid enablement: on-prem services can upload profiles using service account credentials or federation; ensure egress and IAM permissions (e.g., roles/cloudprofiler.agent). Common Misconceptions: Teams often confuse profiling with logging (Cloud Logging) or debugging (Cloud Debugger). Logs and debugger snapshots can show symptoms but do not provide statistically valid, low-overhead, function-level CPU/heap attribution over time. Similarly, “/metrics endpoints” and uptime checks are for availability and basic metrics, not deep code profiling. Exam Tips: When you see “function-level CPU/heap profiles,” “low overhead,” and “managed/centralized without building a pipeline,” think Cloud Profiler. For request-level latency and distributed call graphs, think Cloud Trace; for logs, Cloud Logging; for metrics, Cloud Monitoring. Also consider hybrid identity/authentication and IAM roles as part of the correct implementation details.

17
Question 17

Your fintech startup adheres to SRE practices, and a SEV-1 incident is causing elevated HTTP 5xx errors (38%) in the payment authorization service in us-central1, impacting approximately 65% of live transactions; you are the designated Communications Lead, engineering has no ETA for recovery, and within the first 10 minutes you’ve received over 40 internal Slack DMs and 120 customer tickets requesting updates. What should you do to efficiently keep everyone informed while the mitigation is in progress?

Updating Slack every 30 minutes with a next-update time is good practice for internal comms, but withholding customer updates until a fix is found is not. In a SEV-1 with major transaction impact, customers need immediate acknowledgement, impact scope, and ongoing updates even without an ETA. Delaying external comms increases ticket volume and damages trust.

This matches SRE incident communications best practices: publish periodic updates via agreed channels (internal incident room and public status page) and always include the next-update time. It scales under heavy inbound demand, creates a single source of truth, reduces interruptions to engineering/IC, and sets expectations when there is no ETA. This is the most efficient approach during mitigation.

Delegating internal updates can help, but replying to customer tickets one-by-one with ad hoc notes does not scale (120 tickets in 10 minutes) and risks inconsistent or inaccurate messaging. The Communications Lead should drive broadcast updates through a status page and standardized templates, then reference those updates in ticket responses as needed.

Forwarding all internal inquiries to the Incident Commander is counterproductive. The IC must focus on coordination and decision-making, not handling repetitive questions. This option increases IC load and slows mitigation. The Communications Lead’s purpose is to shield responders from interruptions by consolidating questions and publishing regular, authoritative updates.

Question Analysis

Core Concept - This question tests SRE incident management communications, specifically the Communications Lead role during a SEV-1. In SRE/ICS-style incident response, communications must be structured, predictable, and broadcast through agreed channels to reduce interruption of responders and maintain stakeholder trust. Why the Answer is Correct - Option B is correct because it establishes a single source of truth (public status page for customers; internal incident room/channel for employees) and commits to a next-update time in every message, even when there is no new information. With 38% 5xx errors and 65% transaction impact, stakeholders need frequent, consistent updates. Engineering has no ETA, so the most important action is to set expectations and reduce inbound noise by publishing scheduled updates. This directly addresses the overload of Slack DMs and customer tickets by redirecting everyone to the same authoritative updates. Key Features / Best Practices - SRE best practices include: (1) predefined incident roles (Incident Commander, Communications Lead, Ops/Tech Lead), (2) agreed communication channels (internal incident room, email distribution lists, paging policies, and an external status page), (3) update cadence with a “next update at <time>” commitment, (4) transparency about impact, mitigations in progress, and workarounds, and (5) minimizing context switching for engineers by preventing ad hoc interruptions. This aligns with the Google Cloud Architecture Framework’s operational excellence principles: clear processes, reliable operations, and effective incident response. Common Misconceptions - A seems reasonable (internal first), but delaying customer communication increases ticket volume and erodes trust; customers need timely acknowledgement even without an ETA. C appears customer-focused, but replying one-by-one does not scale and creates inconsistent messaging. D incorrectly routes all internal inquiries to the Incident Commander, increasing IC load and reducing effectiveness; the Communications Lead should absorb and streamline communications. Exam Tips - For DevOps/SRE exam questions, prefer answers that: centralize communication, reduce responder interruption, provide predictable update cadence, and use status pages/incident rooms as the authoritative source. When there is no ETA, explicitly say so and still commit to the next update time; this is a hallmark of mature incident communications.

18
Question 18

Your retail analytics team uses Cloud Build to deploy a containerized Python service to Cloud Run (min instances: 0, max instances: 3) on the staging project; the latest deployment failed because the container exited at startup with exit code 78 and the log message 'KeyError: PAYMENT_SERVICE_URL not set', which has occurred in roughly 30% of recent staging runs when new configs are introduced; you must determine the root cause and add a control in the CI/CD workflow that prevents future rollouts when required environment variables are missing, ensuring the pipeline fails in under 2 minutes if any of PAYMENT_SERVICE_URL, OAUTH_ISSUER, or REGION is absent or empty; what should you do?

A canary rollout on Cloud Run can limit impact by shifting a small percentage of traffic to a new revision. However, it still deploys the broken revision and does not satisfy the requirement to prevent rollouts when required environment variables are missing. It also may not fail the CI/CD pipeline within 2 minutes because detection depends on runtime behavior and traffic patterns rather than a deterministic pre-deploy check.

Static code analysis (linting, style checks, dependency scanning) is valuable in CI, but it does not validate runtime configuration injection (environment variables and secrets). The error is a missing env var at startup, which typically comes from deployment configuration, Secret Manager bindings, or build substitutions. Therefore, static analysis won’t reliably catch the issue or enforce the “absent or empty” checks required.

This directly addresses the root cause class: inconsistent or missing configuration injection. Add a Cloud Build step that runs quickly and validates PAYMENT_SERVICE_URL, OAUTH_ISSUER, and REGION are set and non-empty, using the same Secret Manager/substitution sources intended for Cloud Run. If validation fails, the build fails and the deploy step is gated, preventing rollout. This is deterministic and can complete well under 2 minutes.

Cloud Audit Logs can help determine whether IAM or configuration changes affected deployments, which is useful for troubleshooting. But it is reactive, not preventive, and does not add a CI/CD control to block releases when env vars are missing. It also doesn’t guarantee a fast pipeline failure; it would require manual review or additional automation not described in this option.

Question Analysis

Core concept: This question tests CI/CD pipeline controls for Cloud Run deployments using Cloud Build, specifically “shift-left” validation to prevent bad releases. The failure (exit code 78 with KeyError for a missing env var) is a configuration validation problem, not a runtime scaling or observability problem. Why the answer is correct: Option C adds a fast, deterministic gate in Cloud Build that validates required environment variables (PAYMENT_SERVICE_URL, OAUTH_ISSUER, REGION) are present and non-empty before the deploy step runs. Because the issue occurs when new configs are introduced and only in ~30% of runs, it strongly suggests inconsistent injection of configuration (e.g., missing Secret Manager binding, missing Cloud Build substitution, or conditional logic in the build config). A pre-deploy smoke test that runs the built container (or a lightweight validation entrypoint) with the same env/secret wiring used for Cloud Run will reliably catch missing variables and fail the pipeline within the required <2 minutes. Key features / best practices: - Cloud Build gating: add a step that executes quickly (e.g., a script that checks env vars, or runs the container with an argument like “--check-config”). Then make the deploy step depend on it. - Secret Manager integration: ensure secrets are fetched via Cloud Build (availableSecrets) or substitutions, and passed explicitly to the validation step and the deploy step. This aligns with the Google Cloud Architecture Framework’s reliability principle: prevent failures through automation and pre-deployment checks. - Deterministic failure: checking for “absent or empty” avoids partial rollouts and reduces MTTR by failing early with a clear error. Common misconceptions: - Canary rollouts (A) reduce blast radius but do not prevent a bad revision from being deployed; Cloud Run revisions that fail to start will still cause errors and waste time. The requirement is to prevent rollouts when config is missing. - Static analysis (B) improves code quality but won’t detect missing runtime configuration values. - Audit logs (D) help investigate IAM/config changes but don’t add a preventive CI/CD control and won’t meet the <2-minute fail-fast requirement. Exam tips: When the prompt asks to “prevent future rollouts” and “fail fast,” prefer pipeline gates (unit/integration/smoke/config validation) over progressive delivery or post-deploy monitoring. For Cloud Run, validate configuration and secrets before deployment, and keep checks fast and deterministic to meet strict pipeline timing requirements.

19
Question 19

You are defining latency SLOs for a globally distributed checkout API used by a subscription media platform during concert livestream spikes; stakeholders expect consistent availability and fast responses, and current user feedback indicates performance is satisfactory. Over a rolling 30-day window, telemetry aggregated across all active-active regions shows the 90th percentile latency is 85 ms and the 95th percentile latency is 210 ms, measured at the HTTP request boundary. What latency SLO should the team publish?

This is more stringent than current observed performance (70 ms p90 vs 85 ms, 180 ms p95 vs 210 ms). If published, the service would immediately violate the SLO under normal conditions, rapidly consuming error budget and triggering unnecessary escalations or release freezes. Tightening SLOs is appropriate only when users are dissatisfied or you have already improved performance and can sustain it.

This matches the demonstrated 30-day performance while users report satisfaction. It is a defensible, measurable SLO aligned to current capability and user experience, and it creates an error budget that reflects real operational headroom. It also avoids both chronic SLO breaches (too strict) and allowing regressions (too lenient). This is the best choice given the prompt.

This loosens the SLO above current performance (110 ms p90, 240 ms p95). While it would be easier to meet, it reduces sensitivity to regressions and weakens the reliability promise to stakeholders. Since users are already satisfied at better performance, relaxing the SLO provides no benefit and can permit gradual degradation without triggering action.

This is significantly looser than current performance and would likely mask meaningful latency regressions, especially during global spike events where tail latency impacts checkout completion. Such a permissive SLO undermines the purpose of SLOs as an operational control mechanism and makes error budgets too large to drive prioritization between feature work and reliability work.

Question Analysis

Core Concept: This question tests SRE practices for defining Service Level Objectives (SLOs), specifically latency SLOs based on observed user experience over a rolling window. In Google’s SRE approach, SLOs should be realistic, measurable at a defined boundary, and aligned with user expectations and business outcomes. They also create an error budget that drives operational decisions. Why the Answer is Correct: The prompt states stakeholders expect consistent availability and fast responses, and importantly, current user feedback indicates performance is satisfactory. Over the last 30 days, the service is already delivering 90th percentile latency of 85 ms and 95th percentile latency of 210 ms at the HTTP request boundary across all active-active regions. Publishing an SLO equal to the currently achieved performance (Option B) is appropriate when users are happy and you want an SLO that reflects the present, proven capability. It avoids setting an aspirational target that would immediately burn error budget without user benefit, and it avoids loosening targets that could permit regressions. Key Features / Best Practices: - Define SLOs at the user-visible boundary (here: HTTP request boundary), and use consistent aggregation across regions. - Use a rolling window (30 days) to smooth spikes (e.g., concert livestream surges) while still reflecting recent behavior. - Choose percentiles that represent typical and tail latency (p90/p95). Tail latency matters for user experience and distributed systems. - SLOs should be stable enough to guide decisions (release gates, incident response) and to manage error budgets. Common Misconceptions: Teams often confuse SLOs with goals for improvement. Setting tighter SLOs than current performance (Option A) is tempting, but it creates constant SLO violations and forces unnecessary toil. Conversely, setting looser SLOs (Options C/D) can hide real regressions and reduce accountability. Exam Tips: When user feedback is positive and you have reliable telemetry, set SLOs to what you can consistently achieve today, not what you hope to achieve. Improvement targets belong in internal engineering roadmaps, while SLOs should represent the reliability promise you can meet and defend with an error budget. Also verify the measurement point (client vs load balancer vs service) and aggregation method (global vs per-region) because these can materially change percentile values.

20
Question 20

You work for a fintech company headquartered in Frankfurt where an Organization Policy enforces constraints/gcp.resourceLocations to allow only europe-west3 and europe-west1 for all resources. When you tried to create a secret in Secret Manager using automatic replication, you received the error: "Constraint constraints/gcp.resourceLocations violated for [orgpolicy:projects/1234567890] attempting to create a secret in [global]". You must resolve the error while remaining compliant and ensure the secret’s data resides only in the allowed EU regions. What should you do?

Incorrect. Removing the Organization Policy would resolve the immediate error but breaks compliance and governance requirements. In regulated fintech environments, location constraints are typically mandated for data residency and risk management. The question explicitly requires remaining compliant and keeping secret data only in allowed EU regions, so weakening or removing the guardrail violates the stated constraints and best practices.

Incorrect. Creating the secret with automatic replication is exactly what caused the violation. Automatic replication is treated as a global location because Google controls where replicas are stored, which may include regions outside europe-west1 and europe-west3. Under constraints/gcp.resourceLocations, global resources or resources with non-deterministic placement commonly fail creation.

Correct. User-managed replication lets you explicitly choose the allowed regions (europe-west3 and/or europe-west1), ensuring the secret’s data resides only in those locations and satisfying constraints/gcp.resourceLocations. This approach maintains compliance, supports auditability, and aligns with governance best practices by adapting the resource configuration to the organization’s policy rather than changing the policy.

Incorrect. Adding global to the allowed list would permit automatic replication but would no longer guarantee that secret material stays only in europe-west1 and europe-west3. “Global” implies Google-managed placement that can span beyond the intended regions, undermining strict data residency requirements. This option also weakens organizational governance controls, contrary to the compliance requirement.

Question Analysis

Core Concept: This question tests Organization Policy Service constraints (constraints/gcp.resourceLocations) and how they interact with Secret Manager replication. Secret Manager secrets must be created in locations that comply with the organization’s allowed resource locations. “Automatic replication” is treated as “global” because Google manages multi-region placement, which can include locations outside the explicitly allowed set. Why the Answer is Correct: With constraints/gcp.resourceLocations allowing only europe-west3 and europe-west1, creating a secret with automatic replication violates the policy because the secret’s replication location is [global]. To remain compliant and ensure data residency only in the allowed EU regions, you must create the secret using user-managed replication and explicitly select europe-west3 and/or europe-west1. This makes the secret’s replication policy deterministic and auditable, satisfying both the policy and fintech regulatory expectations. Key Features / Best Practices: - Secret Manager supports two replication modes: automatic (Google-managed, “global”) and user-managed (customer-specified regions). - Organization Policy constraints/gcp.resourceLocations restrict where supported resources can be created and where data can reside. - For regulated workloads, user-managed replication is a best practice for data residency, compliance evidence, and predictable failover characteristics. - Aligns with Google Cloud Architecture Framework governance and compliance principles: enforce guardrails centrally and design workloads to comply rather than weakening controls. Common Misconceptions: Automatic replication can sound “more available” and “still in the EU,” but it is not guaranteed to stay within the allowed regions and is represented as global, triggering policy violations. Another misconception is to “fix” the error by loosening the org policy (removing it or adding global), which would undermine governance and likely violate regulatory requirements. Exam Tips: When you see constraints/gcp.resourceLocations and an error mentioning [global], think “automatic/multi-region/global resource” conflicting with location restrictions. The compliant pattern is to choose a regional or user-managed placement that matches the allowed list. For secrets and keys, explicitly selecting regions is a common exam theme for regulated industries (finance/healthcare).

Success Stories(6)

R
R**********Nov 24, 2025

Study period: 1 month

The exam has many operational scenarios, and Cloud Pass prepared me well for them. The explanations were clear and helped me understand not just the “what” but the “why” behind each solution.

진
진**Nov 20, 2025

Study period: 1 month

문제와 해설이 있어서 좋았고, 시험에서 무난하게 합격했어요. 시험에서 안보이던 유형도 나왔는데 잘 풀긴 했네요

J
J************Nov 17, 2025

Study period: 1 month

The practice questions were challenging in a good way, and many matched the style of the real exam. I passed!

N
N************Nov 14, 2025

Study period: 1 month

very close to the real exam format

D
D***********Oct 18, 2025

Study period: 1 month

I used Cloud Pass during my last week of preparation, and it helped me fill in gaps I didn’t even know I had.

Practice Tests

Practice Test #1

50 Questions·120 min·Pass 700/1000

Other GCP Certifications

Google Associate Cloud Engineer

Google Associate Cloud Engineer

Associate

Google Professional Cloud Network Engineer

Google Professional Cloud Network Engineer

Professional

Google Associate Data Practitioner

Google Associate Data Practitioner

Associate

Google Cloud Digital Leader

Google Cloud Digital Leader

Foundational

Google Professional Cloud Security Engineer

Google Professional Cloud Security Engineer

Professional

Google Professional Cloud Architect

Google Professional Cloud Architect

Professional

Google Professional Cloud Database Engineer

Google Professional Cloud Database Engineer

Professional

Google Professional Data Engineer

Google Professional Data Engineer

Professional

Google Professional Cloud Developer

Google Professional Cloud Developer

Professional

Google Professional Machine Learning Engineer

Google Professional Machine Learning Engineer

Professional

Start Practicing Now

Download Cloud Pass and start practicing all Google Professional Cloud DevOps Engineer exam questions.

Get it on Google PlayDownload on the App Store
Cloud PassCloud Pass

IT Certification Practice App

Get it on Google PlayDownload on the App Store

Certifications

AWSGCPMicrosoftCiscoCompTIADatabricks

Legal

FAQPrivacy PolicyTerms of Service

Company

ContactDelete Account

© Copyright 2026 Cloud Pass, All rights reserved.

Want to practice all questions on the go?

Get the app

Download Cloud Pass — includes practice tests, progress tracking & more.